Will the Dragon Retain Excellence: A Quick Survey On China– Economy, Banking & Financial Markets
- upSpark Technologies

- Feb 1, 2016
- 23 min read
C3S Paper No. 0020/2016

QUANTITATIVE & QUALITATIVE ANALYSIS

China is now the world’s largest manufacturer, merchandise exporter, and holder of foreign exchange reserves. China is currently the second-largest economy after the United States, and some analysts predict that it could become the largest within the next five years or so.
The Chinese government views a growing economy as vital to maintaining social stability.
However, China faces a number of major economic challenges which could dampen future growth, including distortive economic policies that have resulted in over-reliance on fixed investment and exports for economic growth (rather than on consumer demand), government support for state-owned firms, a weak banking system, widening income gaps, and drop in Global demand.,
This report provides a background on China’s economic rise; describes its current economic structure; identifies the challenges China faces to maintain economic growth; and provides a financial view to the challenges, opportunities, and implications of China’s future growth and Global Economic order
DISCLAIMER; THIS REPORT IS MERELY FOR INFORMATION PURPOSES ONLY.THE REPORT IS NOT TO BE RELIED UPON FOR TRADE OR INVESTMENTS WITH CHINA.THE REPORT IS PREPARED FROM DATA AVAILABLE IN PUBLIC DOMAIN AND CAN NOT VOUCH FOR THE ACCURACY OF DATA.
China at the Crossroads?
Concerns
In 2014, China’s economy continued to slow down.
In 2015, growth is estimated at 7 percent, slower than 2014.
Causes:
Deceleration in growth.
Painful economic restructuring and the hangover of previous economic stimulus policies.
Weakening demand, industrial overcapacity and property market adjustment.
Effect:
GDP is expected to grow at around 7.4 percent in 2014 on an annualized basis, the lowest since 1990.
Financial risks gathering and increasing amid the rising costs of production and other factors.
Increase in nonperforming assets in the books of major banks.
Defaults by huge corporations of regional governments in banking & financial markets.
Elevated leverage ratio and weakening profitability of enterprises.
Heavier pressure on resources and environments.
Diminishing comparative advantages.
Huge industrial overcapacity.
Structural Initiatives
China is shifting its primary growth engine from export – led manufacturing and infrastructure development to consumption and innovation, shifting into a new normal moderate growth, optimized structure and better quality.
Major reforms in banking and financial sector.
Outlook:
We expect the government to set the target GDP growth rate at about 7 percent for 2015, down 0.5 percentage point from 2014. Meanwhile, the tertiary industry which account for about 48 percent of GDP, is expected to contribute more to growth stabilization and job creation. Agriculture is expected to remain flat at 10 percent. The services sector is expected to contribute the remaining 50 percent of growth. Consumption will contribute to about 50 percent of incremental growth, 1 percentage point higher than in 2014, with hot spots continuing.
Both agriculture and manufacturing are expected to remain flat in the short to medium term.
THE GREAT LEAP
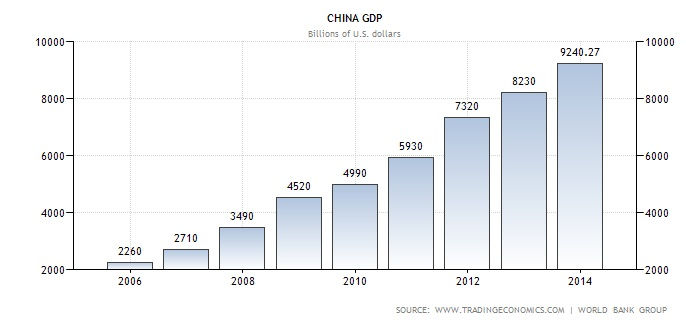
China GDP Annual Growth Rate
The Gross Domestic Product (GDP) in China expanded 7.30 percent in the fourth quarter of 2014 over the same quarter of the previous year. GDP Annual Growth Rate in China averaged 9.08 percent from 1989 until 2014, reaching an all time high of 14.20 percent in the fourth quarter of 1992 and a record low of 3.80 percent in the fourth quarter of 1990. GDP Annual Growth Rate in China is reported by the National Bureau of Statistics of China.
China GDP per capita PPP 1990-2015
The Gross Domestic Product per capita in China was last recorded at 11524.57 US dollars in 2013, when adjusted by purchasing power parity (PPP). The GDP per Capita, in China, when adjusted by Purchasing Power Parity is equivalent to 65 percent of the world’s average. GDP per capita PPP in China averaged 5061.14 USD from 1990 until 2013, reaching an all time high of 11524.57 USD in 2013 and a record low of 1554.01 USD in 1990. GDP per capita PPP in China is reported by the World Bank.
China Inflation Rate 1986-2015
The inflation rate in China was recorded at 0.80 percent in January of 2015. Inflation Rate in China averaged 5.65 percent from 1986 until 2015, reaching an all time high of 28.40 percent in February of 1989 and a record low of -2.20 percent in April of 1999. Inflation Rate in China is reported by the National Bureau of Statistics of China.
China Food Inflation 1993-2015
Food Inflation in China decreased to 1.10 percent in January of 2015 from 2.90 percent in December of 2014. Food Inflation in China averaged 6.46 percent from 1993 until 2015, reaching an all time high of 40.20 percent in October of 1994 and a record low of -5.50 percent in April of 1999. Food Inflation in China is reported by the National Bureau of Statistics of China.
China Trade
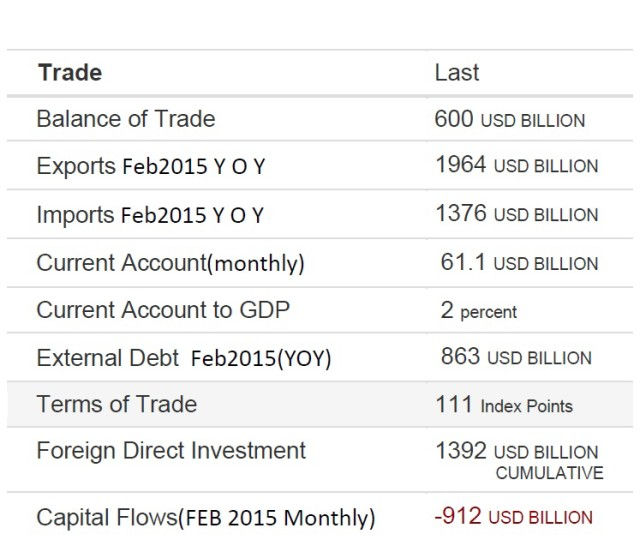
SOURCE: Trading Economics
Since 1995, China has been recording consistent trade surpluses which from 2004 to 2009 has increased 10 times. In 2014 as a whole, China’s trade growth reached only 3.4 percent, below the 7.5 percent target, as exports rose at a slower pace and imports almost remained unchanged. In 2014, the biggest trade surpluses were recorded with Hong Kong, the United States, Netherlands, Vietnam and the United Kingdom. China recorded trade deficits with Taiwan, South Korea, Australia and Germany.
In China, external debt is a part of the total debt that is owed to creditors outside the country.
Foreign Direct Investment (FDI) in China
China’s trade and investment reforms and incentives led to a surge in FDI beginning in the early 1990s. Such flows have been a major source of China’s productivity gains and rapid economic and trade growth. There were reportedly 445,244 foreign-invested enterprises (FIEs) registered in China in 2010, employing 55.2 million workers or 15.9% of the urban workforce. FIEs account for a significant share of China’s industrial output. That level rose from 2.3% in 1990 to a high of 35.9% in 2003, but fell to 25.9% as of 2011. In addition, FIEs are responsible for a significant level of China’s foreign trade. In 2013, FIEs in China accounted for 47.3% of China’s exports and 44.8% of its imports, although this level was down from its peak in 2006 when FIEs’ share of Chinese exports and imports was 58.2% and 59.7%, respectively.FIEs in China dominate China’s high technology exports. From 2002 to 2010, the share of China’s high tech exports by FIEs rose from 79% to 82%. During the same period, the share of China’s high tech exports by wholly owned foreign firms (which excludes foreign joint ventures with Chinese firms) rose from 55% to 67%.


Source: Congressional Research Service
China’s Growing FDI Outflows
A key aspect of China’s economic modernization and growth strategy during the 1980s and 1990s was to attract FDI into China to help boost the development of domestic firms. Investment by Chinese firms abroad was sharply restricted. However, in 2000, China’s leaders initiated a new “go global” strategy, which sought to encourage Chinese firms (primarily SOEs) to invest overseas. One key factor driving this investment is China’s massive accumulation of foreign exchange reserves. Traditionally, a significant level of those reserves has been invested in relatively safe, but low-yielding, assets, such as U.S. Treasury securities. On September 29, 2007, the Chinese government officially launched the China Investment Corporation (CIC) in an effort to seek more profitable returns on its foreign exchange reserves and diversify away from its U.S. dollar holdings. The CIC was originally funded at $200 billion, making it one of the world’s largest sovereign wealth funds. Another factor behind the government’s drive to encourage more outward FDI flows has been to obtain natural resources, such as oil and minerals, deemed by the government as necessary to sustain China’s rapid economic growth. Finally, the Chinese government has indicated its goal of developing globally competitive Chinese firms with their own brands. Investing in foreign firms, or acquiring them, is viewed as a method for Chinese firms to obtain technology, management skills, and often, internationally recognized brands, needed to help Chinese firms become more globally competitive. For example, in April 2005, Lenovo Group Limited, a Chinese computer company, purchased IBM Corporation’s personal computer division for $1.75 billion. Similarly, overseas FDI in new plants and businesses is viewed as developing multinational Chinese firms with production facilities and R&D operations around the world.
China has become a significant source of global FDI outflows, which, according to the U.N., rose from $ 2.7 billion in 2002 to $101 billion in 2013 China ranked as the third-largest source of global FDI in 2013 (up from sixth in 2011). The stock of China’s outward FDI through 2013 is estimated at $512 billion.
China’s FDI outflows by destination for 2012 indicate that the largest destinations of total Chinese FDI through 2012 were Hong Kong (57.5% of total), the BVI, the Cayman Islands, the United States, and Australia. In terms of Chinese FDI flows in 2012, the largest recipients were Hong Kong (58.3% of total), the United States, Kazakhstan, the United Kingdom, and the BVI.
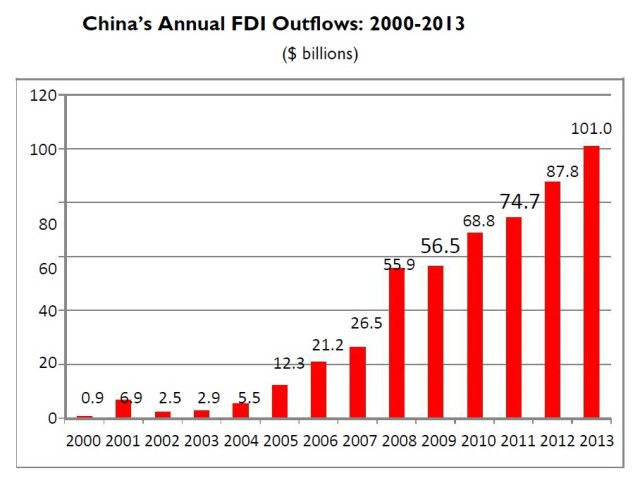
Source: United Nations
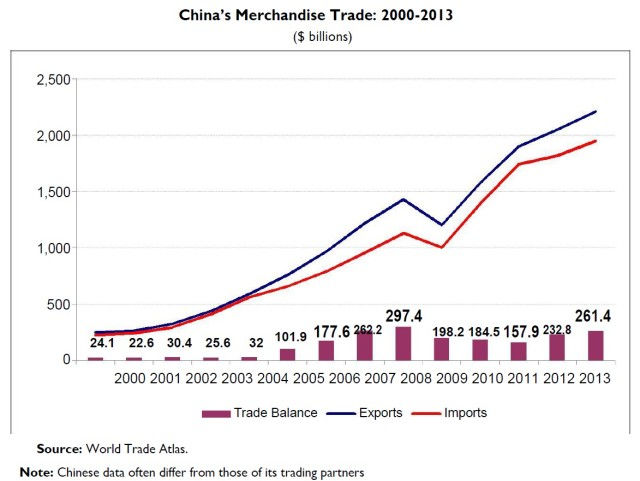
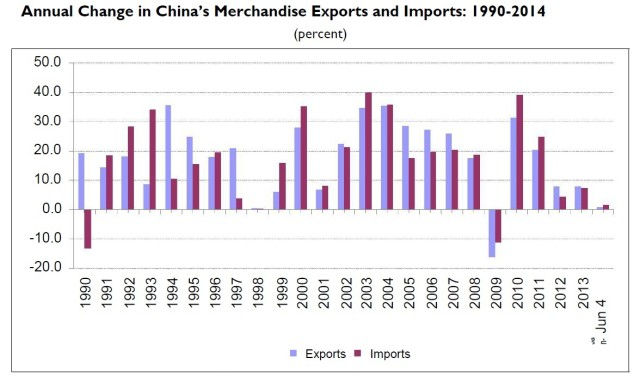
Source: Global Trade Atlas Using Official Chinese Data
China Gross Fixed Capital Formation 1952-2015
Gross Fixed Capital Formation in China increased to 4341billionUS$ in 2013 from 3900billionUS$ in 2012. Gross Fixed Capital Formation in China averaged 559billionUS$ from 1952 until 2013, reaching an all time high of 4341billionUS$ in 2013. Gross Fixed Capital Formation in China is reported by the National Bureau of Statistics of China.
Gross fixed capital formation includes spending on land improvements (fences, ditches, drains, and so on); plant, machinery, and equipment purchases; the construction of roads, railways, private residential dwellings, and commercial and industrial buildings.
Amount in CNY Hundred Million
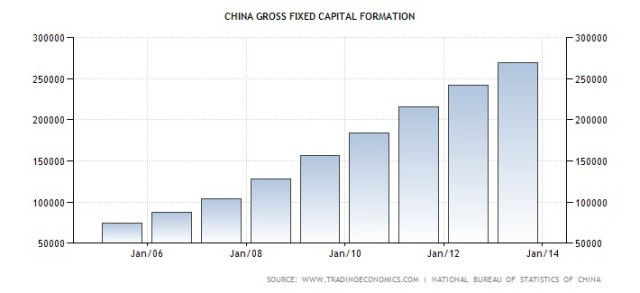
(Amount in CNY hundred million)
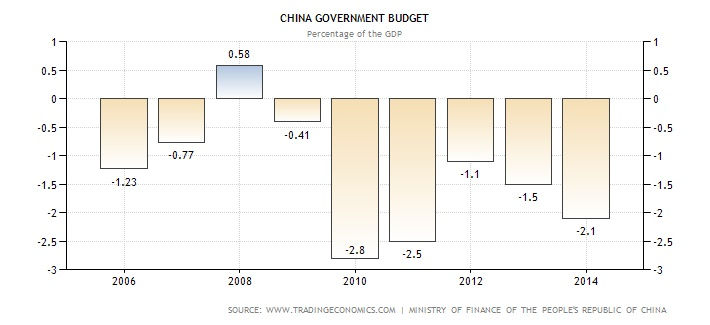
China Government Budget 1990-2015
China recorded a government budget deficit of 236billionUS$ in December of 2014. Government Budget Value in China averaged -3.9billion US$ from 1990 until 2014, reaching an all time high of 95billion US$ in January of 2012 and a record low of -251billion US$ in December of 2013.
Total Budget is US$2.2 trillion (2014)
Government Budget Value in China is reported by the National Bureau of Statistics of China
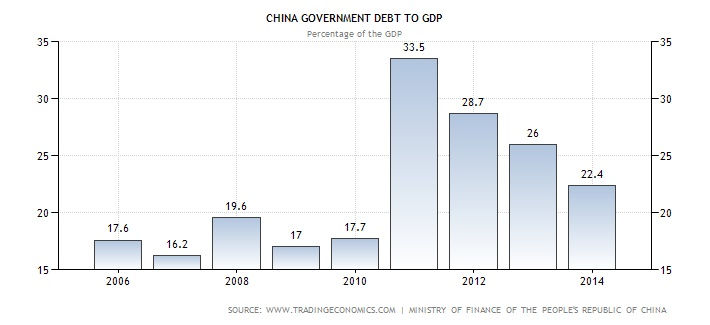
China Government Debt to GDP 1984-2015
China recorded a Government Debt to GDP of 22.40 percent of the country’s Gross Domestic Product in 2013. Government Debt to GDP in China averaged 12.94 Percent from 1984 until 2013, reaching an all time high of 33.50 Percent in 2010 and a record low of 1 Percent in 1984. Government Debt to GDP in China is reported by the Ministry of Finance of the People’s Republic of China.
China’s debt remains low relative to GDP
China Taxes taxesLastReference Corporate Tax Rate25 percentJan/14 Personal Income Tax Rate45 percentJan/14 Sales Tax Rate17 percent
Source: Trading Economics-State Administration of Taxes
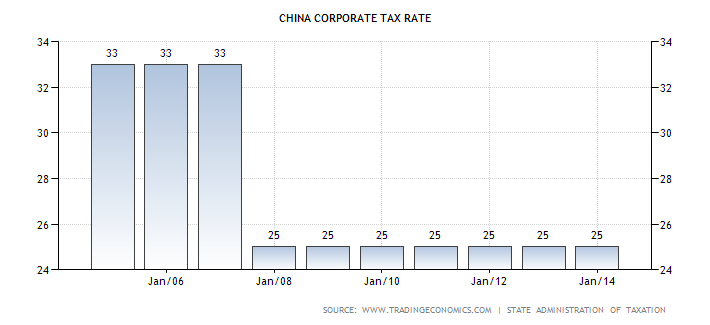
In China, the Corporate Income tax rate is a tax collected from companies. Its amount is based on the net income companies obtain while exercising their business activity, normally during one business year. The benchmark used, refers to the highest rate for Corporate Income. Revenues from the Corporate Tax Rate are an important source of income for the government of China.
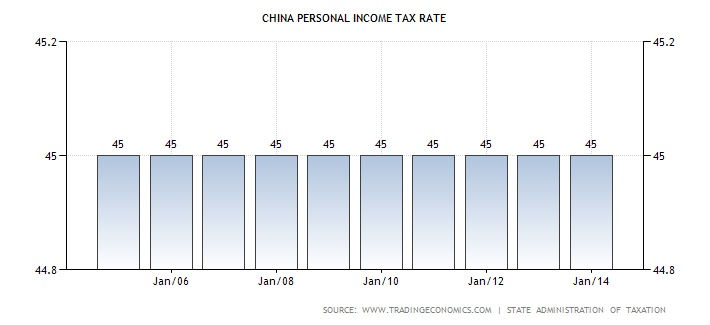
In China, the Personal Income Tax Rate is a tax collected from individuals and is imposed on different sources of income like labour, pensions, interest and dividends. The benchmark we use refers to the Top Marginal Tax Rate for individuals. Revenues from the Personal Income Tax Rate are an important source of income for the government of China.
Social Security Tax
For companies 37%
For Individuals 11%
In China, the Social Security Rate is a tax related with labor income charged to both companies and employees. Revenues from the Social Security Rate are an important source of income for the government of China because they help to pay for many social programs including welfare, health care and many other benefits- March 24, 2015.
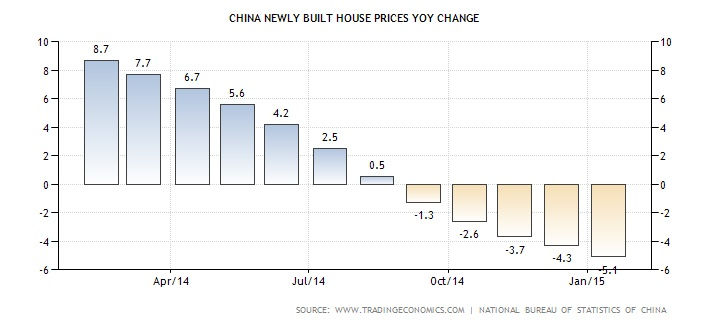
Housing sector registered no growth in the lead up to the year 2014 when the economy grew at 7.5%
The Government’s ambitious plans to accelerate urbanization has suffered in the process in 2014
China Newly Built House Prices YoY Change 2011-2015
China newly built house prices decreased 5.10 percent in January of 2015 over the same month of the previous year, the largest drop on record. In Beijing, prices decreased 3.2 percent year-on-year and in Shanghai prices were down 4.2 percent. Housing Index in China averaged 2.94 percent from 2011 until 2015, reaching an all time high of 9.90 percent in November of 2013 and a record low of -5.10 percent in January of 2015. Housing Index in China is reported by the National Bureau of Statistics of China.
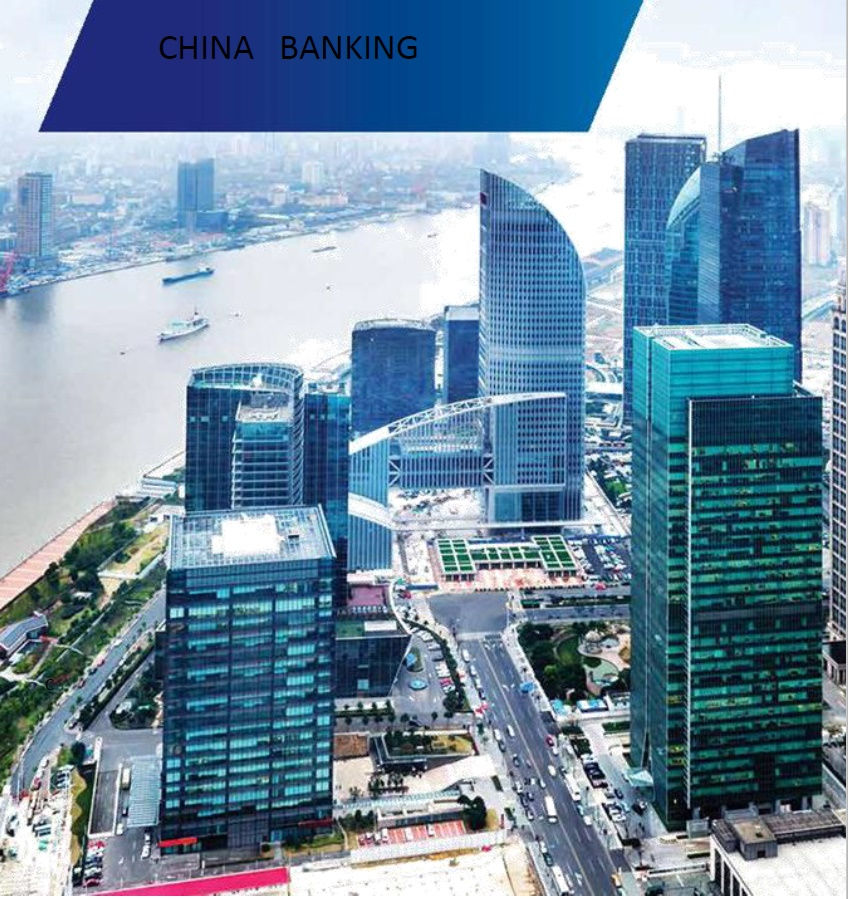
Six of the World’s biggest banks are from China
INDUSTRIAL&COMMERCIAL BANK OF CHINA
CHINA CONSTRUCTION BANK CORPORATION
BANK OF CHINA
CHINA DEVELOPMENT BANK CORPORATION
BANK OF COMMUNICATION COMPANY
SHANGAI&PUDONG DEVELOPMENT BANK
CURRENT TRENDS
Despite concerns over shadow banking in China, the banking sector has remained broadly stable in 2014. Although income growth is slowing, it is converging into more normal trend growth rates.
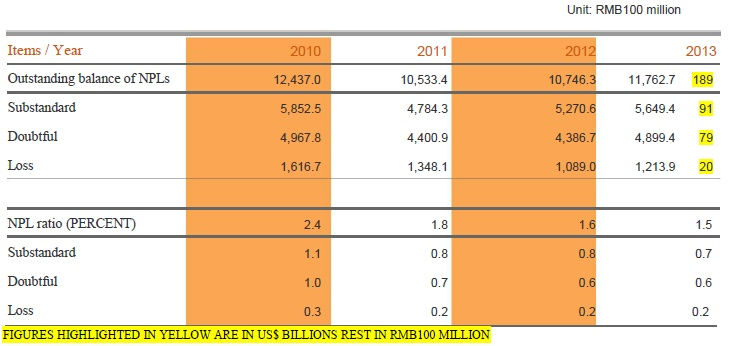
Non performing loans (“NPLs”) and overdue loans balances have risen sharply driven by the deceleration of the economy. The increase in NPLs was more noticeable in selected industries and SMEs. Overall, the sector’s NPL ratio remained at 1.6 percent at the end of 2013.
Adequate provisioning has enabled banks to write-off bad debts in 2013. As a result, provision coverage to NPL fell by 9 percentage points in the first nine months of 2013, but even so remains at a healthy 287 percent in September 2013.How ever stressed loans and NPAs and are widely expected to go up in 2014-2015,mainly on account of stagnation in industry &Real Estate &infrastructure
Implementation of Basel III2 since January 2013 has been smooth and as the next step, the major national banks are expected to migrate into internal rating based models, strengthening risk management and capital ratios.
The development and growth in China’s bond market is accelerating (notably with the recent rules on bank CD issues) and penetration of money market funds is beginning to grow from 2013.But lag behind significantly by Global standards
Interest rate liberalisation, as defined as further relaxation of interest rate rules, will be in its final stages over the next few years. However, removal of the rate rules does not necessarily mean aggressive pricing competition amongst banks in China
The reality is that there has been little difference in pricing between banks
The only interest rate rule remains is deposit rate cap, which is set at 1.1x of the benchmark rates across different maturities. The PBOC is likely to raise the upper limits of deposit rates
The growth of non-traditional banking products is a vitally important step of China’s financial liberalisation process.But that is still a long way ahead
The Banking&Financial Sector Reforms by CBRC is unlikely to be a major de-stabilisation factor in the banking industry and in the next few years, China is expected to fully usher in robust Banking and Financial markets like the rest of the free market economies
Amongst all financial institutions in China, more than 90 percent of financial assets are controlled by commercial banks. In this light, the rapid growth in non-traditional banking products should exert more competitive pressure on banks, helping to improve pricing mechanism and competitions in the industry.
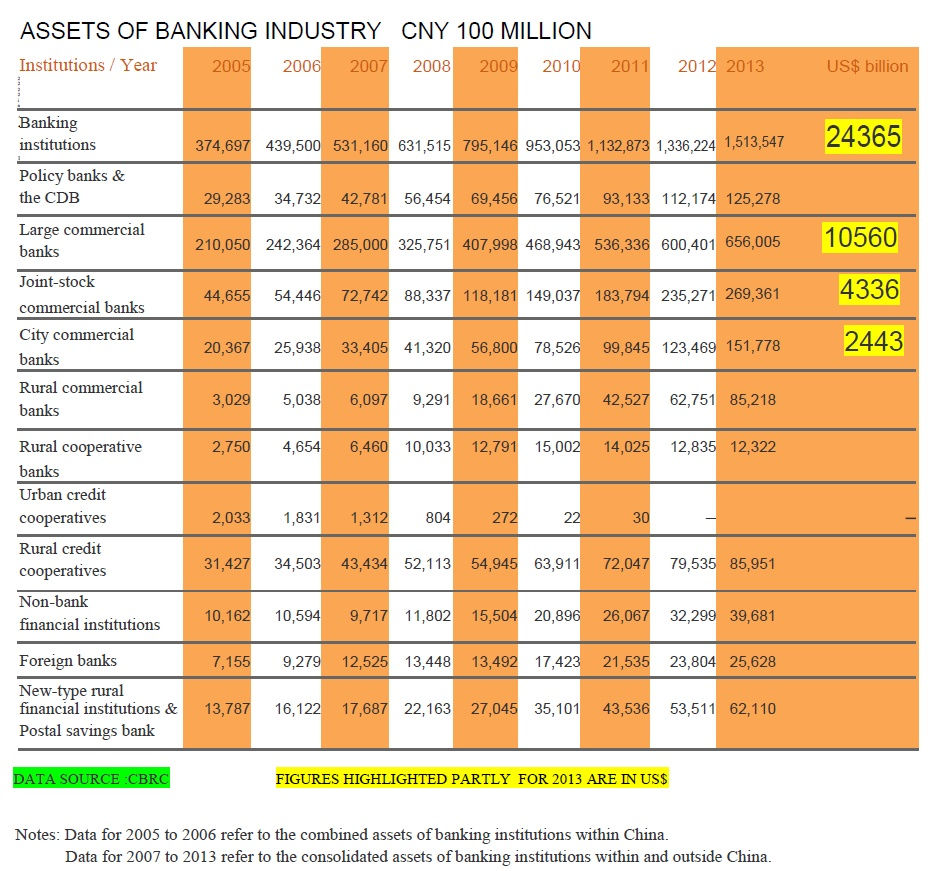
In comparison to their overseas counterparts, the four state-owned commercial banks exhibit strong capabilities and competitiveness compared to either in terms of asset scale, profitability and growth rate .As @September 2013

However, slowing economic growth and increased interest rate liberalisation have led to the banking sector experiencing an increase in non-performing loans and a slowdown in profit growth in 2014
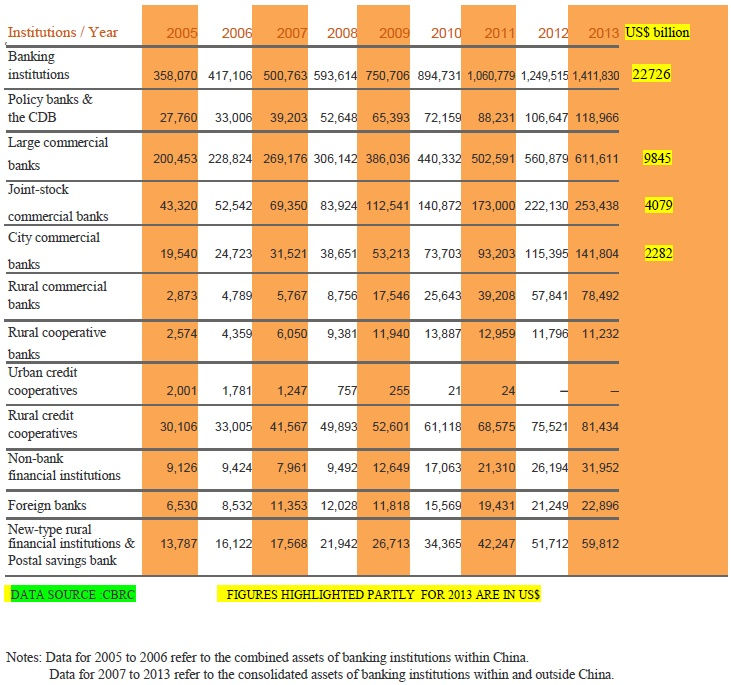
Total liabilities of banking institutions (2003—2013)
RMB 100 MILLION
Total owner’s equity of banking institutions (2003—2013)
RMB100 MILLION
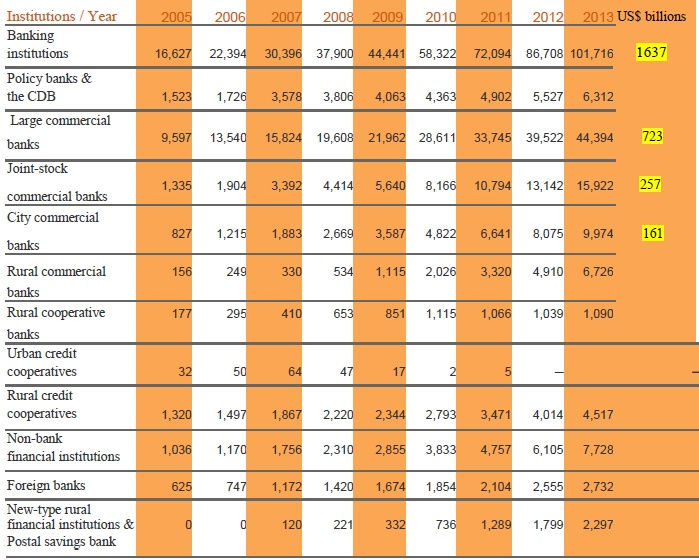
DATA SOURCE :CBRC FIGURES HIGHLIGHTED PARTLY FOR 2013 ARE IN US$
Total deposits and loans of banking institutions (2003—2013)
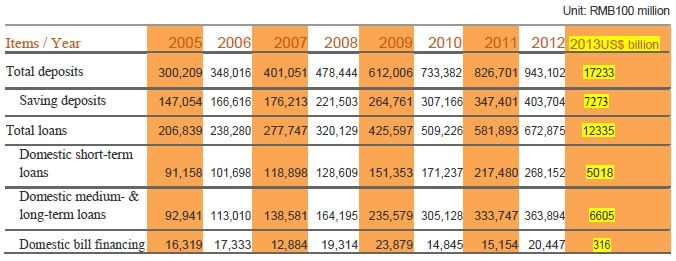
Data are from the People’s Bank of China.
Profit after tax of banking institutions (2007—2013)
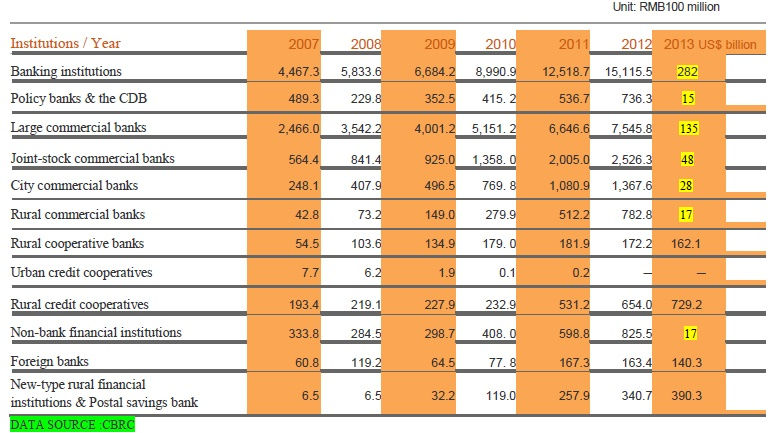
FIGURES HIGHLIGHTED FOR 2013 IN US$ BILLIONS REST IN RMB100MILLION
Returns of banking institutions (2007—2013)

NPLs of banking institutions (2010—2013)
Liquidity ratio of banking institutions (2007—2013)

DATA SOURCE :CBRC
How is monetary policy conducted in China?
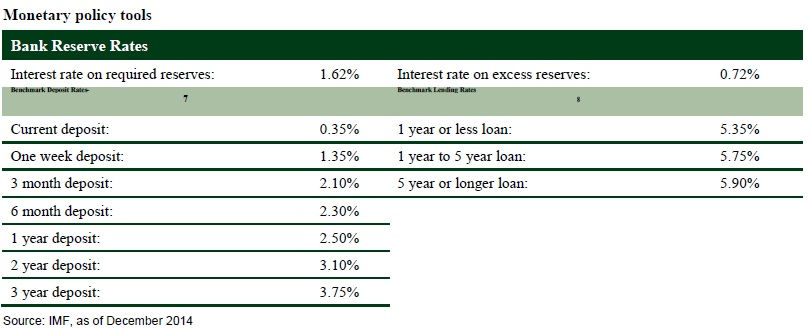
The PBoC is the Central Bank of the People’s Republic of China with the power to control monetary policy in mainland China. The PBoC conducts monetary policy through open market operations, which affect the amount of reserves in the banking system, and by setting the reserve requirement ratio for Chinese commercial banks, which affects the amount of bank lending. The current RRR is 20% and 18% for major-sized and middle- / small-size
Interest Rates
On 7 June 2012, the PBoC started to introduce some flexibility to the bank deposit rate, and banks are allowed to offer deposit rates over benchmark deposit rates by no more than 10%. On 20 July 2013, the PBoC removed the restriction of 30% downward floating to benchmark lending rates, lifting the restrictions on lending rates. On 21 November 2014 and 28 February 2015, the PBoC further released the upper limit over benchmark deposit rates from 10% to 30%, when it announced base rates cut. We believe these moves are considered to be very important steps forward to the liberalization of interest rate control
How are open market operations conducted?
The PBoC conducts open market operations on every Tuesday and Thursday, selling Central Bank notes and repos to 49 primary dealers.
What are the new tools the PBoC introduced to manage liquidity?
From early 2013, other than SLO, the PBoC implemented new liquidity management tools including Standing Lending Facility (SLF), Pledged Supplemented Lending (PSL) and Medium-term Lending Facility (MLF). These tools will help decrease the volatility of money market rates and will help to construct a policy interest rate framework from very short term to long term, moving forward.
SLO-SHORT TERM LIQUIDITY OPERATIONS
Standard & Poor credit rating for China stands at AA-. Moody’s rating for China’s sovereign debt is Aa3. Fitch’s credit rating for China is A+. All very good ratings. In general, a credit rating is used by sovereign wealth funds, pension funds and other investors to gauge the credit worthiness of China thus having a big impact on the country’s Borrowing costs &FII inflows
How large is China’s bond market?
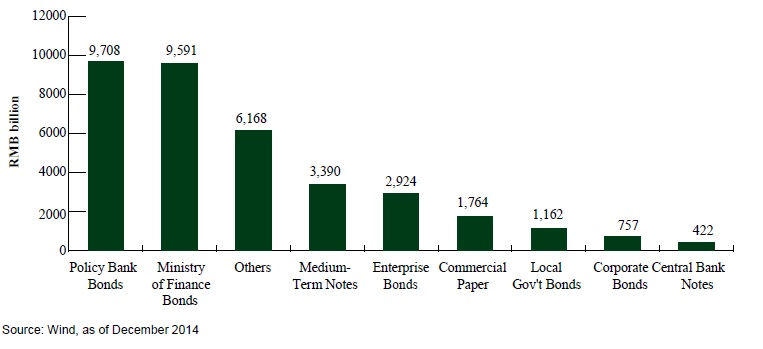
As China’s economy has grown, the country has developed a large and increasingly diverse market that includes both public and private debt China’s bond market is now the third largest in the world at about RMB 35.89 trillion, or about USD 5.74 trillion.
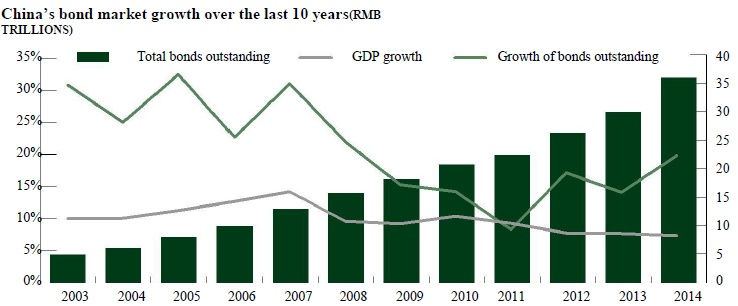
Source: Wind, as of December 2014
China’s Bond Market is the third largest in the world
How are bonds traded in China?
From a trading perspective, China has two bond markets: the Inter-bank bond market, which is regulated by the People’s Bank of China (PBoC), and the Exchange bond market, which is regulated by the China Securities Regulatory Commission (CSRC).
The Inter-bank market is much larger than the Exchange market, accounting for more than 95% of total trading volume.
Trading activity has grown rapidly and the market is very liquid, with about USD 57 trillion in total trading volume in 2014
What types of bonds are available in China’s market?
Government bonds Central Bank notes, Financial bonds, Non-Financial Corporate bonds
Fig. 4: The size of various sectors of the market
Who are the largest participants in China’s bond market?
Commercial banks dominate trading activity in China’s Inter-bank bond market, accounting for around 70% of trading volume. Because bank deposits are the most important investment tools for Chinese households, commercial banks have very large balance sheets. However, local commercial banks have limited channels for investing, because regulations prohibit these banks from investing in equities or futures markets. Other major participants include asset managers and insurance companies, although both are small relative to banks in terms of bond trading.
How are corporate bonds different from enterprise bonds?
Enterprise bonds are a much larger and a more actively traded sector of the Chinese bond market compared to corporate bonds. Enterprise bonds are bonds issued by institutions affiliated to Central Government departments, enterprises solely funded by the State, state-controlled enterprises and other large-sized state-owned entities.Enterprise bond issuance is subject to administrative approval for a quota from the National Development and Reform Commission (NDRC). Typically, enterprise bonds are issued to fund infrastructure construction, fixed asset investment, key technical renovations& public welfare.
Chinese Currency & Exchange Rate
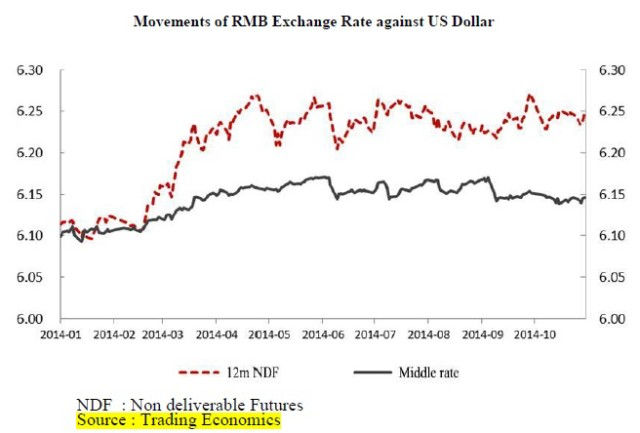
The US Dollar decreased to 6.21 Chinese Yuan in March from 6.26 in February of 2015. The Chinese Yuan averaged 6.95 from 1981 until 2015, reaching an all time high of 8.73 in January of 1994 and a record low of 1.53 in January of 1981.
RMB exchange rate ,likely to pick up slightly, swinging more widely in both directions
Up to the end of October 2014, the middle exchange rate of RMB against USD was 6.1461, representing a mild depreciation of 0.77% when compared with the beginning of 2014. Overall, RMB exchange rate against USD experienced two phases in 2014: The first phase was the period from January through May when the RMB fell in value continuously against USD, by 1.16% cumulatively. The second phase started from June, featuring an overall increase and notable two-way fluctuations of RMB exchange rate against USD. At the end of October, the middle exchange rate of RMB against USD rose slightly by 0.38% from the end of May.
In 2015, RMB exchange rate against USD is estimated to further rise slightly while fluctuating more widely in both directions China’s current account surplus as a percentage of GDP fell from the 2007 peak of 10% to 2.1% in As the current account balance is moving increasingly closer to zero,
RMB exchange rate is near its equilibrium level and unlikely to rise or fall continuously. Secondly, the trading range of the RMB against the USD widened from 1% to 2% on March 17, 2014, and is expected to further expand in the future. Thirdly, the US Federal Reserve officially announced the end of QE in late October2014,This is expected to start rate rises in 2015.
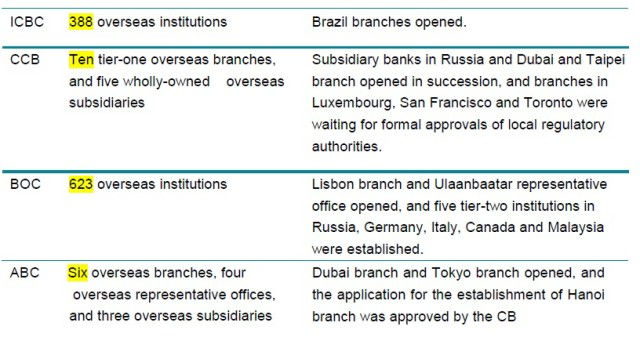
Chinese banks’ development overseas
Overview of the overseas expansion of the four largest state-owned banks (as at the end of June 2013)
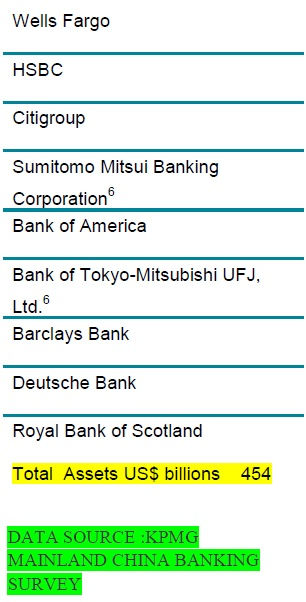
Foreign Banks in China
SHADOW BANKING RISKS
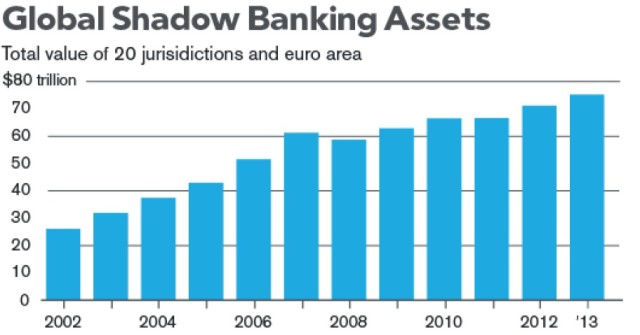
The scale of Global Shadow banking is almost unfathomable: $75 trillion worldwide or may be more. The Financial Stability Board says it poses “systemic risks” to the global financial system. It’s growing at phenomenal rates in China and booming in Western banking capitals as well. The catchall phrase “shadow banking” encompasses risky investment products, lending between individuals, pawnshop and loan-shark operations in emerging markets, as well as more respectable activities like derivatives, money-market funds, securities lending and repurchase agreements at financial institutions in Europe and the U.S. The common denominator is that these activities flourish outside the regular banking system and often beyond the control of regulators and monetary policy. Together they show how hard it is to restrict risky lending without causing harm.
Source: Bank of International Settlements
The Chinese Dilemma
The Brookings Institute says clearly in its latest report that China’s shadow banking sector is not especially large by international standards,with low levels of securitized assets and derivatives
The Chinese regulators have so far shown themselves alive to the most important risks, namely funding risks and transparency and have taken prudent steps to minimize the risks.The authorities have taken seriously their mandate to maintain financial stability and have acted pre-emptively ,like in the year 2013 to nip the bud practices that may threaten the stability.The IMF estimates the size of China’s shadow banking at 35% of GDP in 2014.Not alarming compared to transparent shadow banking size in the U S or Japan
Major Long-Term Challenges Facing the
Chinese Economy
China’s economy has shown remarkable growth over the past several years, and many economists project that it will enjoy fairly healthy growth in the near future. However, economists caution that these projections are likely to occur only if China continues to make major reforms to its economy. Failure to implement such reforms could endanger future growth. They note that China’s current economic model has resulted in a number of negative economic (and social) outcomes, such as over-reliance on fixed investment and exporting for its economic growth, extensive inefficiencies that exist in many sectors (due largely to government industrial policies), wide-spread pollution, and growing income inequality, to name a few. Many of China’s economic problems and challenges stem from its incomplete transition to a free market economy and from imbalances that have resulted from the government’s goal of economic growth at all costs.
China’s Incomplete Transition to a Market Economy
Despite China’s three-decade history of widespread economic reforms, Chinese officials contend that China is a “socialist-market economy.” This appears to indicate that the government accepts and allows the use of free market forces in a number of areas to help grow the economy, but the government still plays a major role in the country’s economic development.
Industrial Policies and SOEs
According to the World Bank, “China has become one of the world’s most active users of industrial policies and administrations.According to one estimate, China’s SOEs may account for up of 50% of non-agriculture GDP. In addition, although the number of SOEs has declined sharply, they continue to dominate a number of sectors (such as petroleum and mining, telecommunications, utilities, transportation, and various industrial sectors); are shielded from competition; are the main sectors encouraged to invest overseas; and dominate the listings on China’s stock indexes. One study found that SOEs constituted 50% of the 500 largest manufacturing companies in China and 61% of the top 500 service sector enterprises. It is estimated that there were 154,000 SOEs as of 2008, and while these accounted for only 3.1% of
The World Bank, China:2030,
U.S.-China Economic and Security Review Commission, An Analysis of State-owned Enterprises and State Capitalism in China, by Andrew Szamosszegi and Cole Kyle, October 26, 2011,
The nature of China’s SOEs has become increasing complex. Many SOEs appear to be run like private companies. For example, a number of SOEs have made initial public offerings in China’s stock markets and those in other countries (including the United States), although the Chinese government is usually the largest shareholder. It is not clear to what extent the Chinese government attempts to influence decisions made by the SOE’s which have become shareholding companies.
Xiao Geng, Xiuke Yang, and Anna Janus, State-owned Enterprises in China, Reform Dynamics and Impacts, 2009,
China’s Economic Rise: History, Trends, Challenges
all enterprises in China, they held 30% of the value of corporate assets in the manufacturing and services sectors. Of the 58 Chinese firms on the 2011 Fortune Global 500 list, 54 were identified as having government ownership of 50% or more. The World Bank estimates that more than one in four SOEs lose money.
The Banking System
China’s banking system is largely controlled by the central government, which attempts to ensure that capital (credit) flows to industries deemed by the government to be essential to China’s economic development. SOEs are believed to receive preferential credit treatment by government banks, while private firms must often pay higher interest rates or obtain credit elsewhere. According to one estimate, SOEs accounted for 85% ,of all bank loans in 2009. In addition, the government sets interest rates for depositors at very low rates, often below the rate of inflation, which keeps the price of capital relatively low for firms. It is believed that oftentimes SOEs do not repay their loans, which may have saddled the banks with a large amount of nonperforming loans. In addition, local governments are believed to have borrowed extensively from state banks shortly after the global economic slowdown began to impact the Chinese economy to fund infrastructure and other initiatives. Some contend these measures could further add to the amount of nonperforming loans held by the banks. Many analysts contend that one of the biggest weaknesses of the banking system is that it lacks the ability to ration and allocate credit according to market principles, such as risk assessment.
Local government debt is viewed as a growing problem in China, largely because of the potential impact it could have on the Chinese banking system. During the beginning of the global financial slowdown, many Chinese subnational government entities borrowed extensively to help stimulate local economies, especially by supporting infrastructure projects. In December 2013, the Chinese National Audit Office reported that from the end of 2010 to mid-year 2013, local government debt had increased by 67% to nearly $3 trillion.
An Undervalued Currency
China does not allow its currency to float and therefore must make large-scale purchases of dollars to keep the exchange rate within certain target levels. Although the renminbi (RMB) has appreciated against the dollar in real terms by about 40% since reforms were introduced in July 2005, some analysts contend that it remains highly undervalued. China’s undervalued currency makes its exports less expensive, and its imports more expensive, than would occur under a
floating exchange rate system. In order to maintain its exchange rate target, the government must purchase foreign currency (such as the dollar) by expanding the money supply. This makes it much more difficult for the government to use monetary policy to combat inflation.
Many economists argue that China’s industrial policies have sharply limited competition and the growth of the private sector, caused over-capacity in many industries, and distorted markets by artificially lowering the costs of various factor costs (such as capital, water, land, and energy) below market levels in order to promote targeted industrial sectors. Such policies have come at the expense of other (non-industrial) sectors of the economy, such as services.
China’s Economic Rise: History, Trends, Challenges
Overdependence on Exporting and Fixed Investment
A 2009 IMF report estimated that fixed investment related to tradable goods plus net exports together accounted for over 60% of China’s GDP growth from 2001 to 2008 (up from 40% from 1990 to 2000), which was significantly higher than in the G -7 countries (16%), the euro area (30%), and the rest of Asia (35%). As indicated, from 1990 to 2013, Chinese gross savings as a percent of GDP and gross fixed investment as a percent of GDP both increased significantly, while private consumption as a percent of GDP declined sharply. In addition, , personal disposable income in China as a share of GDP was lower in 2013 (43.9%) than it was in 2000 (47.9%). China’s gross savings as a percent of GDP and gross fixed investment as a percent of GDP are the highest among any of the world’s largest economies, while China’s private consumption as a share of GDP is the lowest.
Many economists contend that the falling share of private consumption and disposable income relative to GDP is largely caused by two main factors: China’s banking policies and the lack of an adequate social safety net. The Chinese government places restrictions on the export of capital. As a result, Chinese households put a large share of their savings in domestic banks. The Chinese government sets the interest rate on deposits. Often this rate is below the rate of inflation, which lowers household income. Some economists consider this policy to constitute a transfer of wealth from Chinese households to Chinese firms which benefit from low interest rates. This “tax” on household income negatively affects household consumption. Secondly, China’s lack of an adequate social safety net (such as pensions, health care, unemployment insurance, and education) induces households to save a large portion of their income. According to one estimate, the average saving rate of urban households relative to their disposable incomes rose from 18% in 1995 to nearly 29% in 2009. Corporations are also a major contributor to the high savings rate in China. Many Chinese firms, especially SOEs, do not pay out dividends and thus are able to retain most of their earnings. Many economists contend that requiring the SOEs to pay dividends could boost private consumption in China.
Chinese economic policies have resulted in gross fixed investment being the main engine of the country’s economic growth for every year from 2000 to 2013. (In 2011 gross fixed investment and private consumptions each accounted for 3.0 percentage points.
If Chinese banks raised interest rates in an effort to control inflation, overseas investors might to try to shift funds to China to take advantage of the higher Chinese rates. The Chinese government has had difficulty blocking such inflows of “hot money.” Such inflows force the government to boost the money supply to buy up the foreign currency necessary to maintain the targeted peg. Expanding the money supply contributes to easy credit policies by the banks, which has contributed to overcapacity in a number of sectors, such as steel, and speculative asset bubbles (such as in real estate). This often forces the government to use administrative controls to limit credit to certain sectors.
Guo, Kai and Papa N’Diaye, Is China’s Export-Oriented Growth Sustainable, IMF Working Paper, August 2009
CHINA LOOKING FORWARD YEAR 2015 PLUS
CHALLENGES POLICY-ACTIONS-SOLUTIONS
DECELARATION IN GROWTH
WEAKENING DEMAND
HUGE INDUSTRIAL OVER CAPACITY
DE-STOCKING&CAPACITY CUTS
LOPSIDED INVESTMENTS IN INFRASRTUCTURE
HEAVIER PRESSSURE ON RESOURCES
DIMINISHING COMPETITIVE ADVANTAGE
TRANSITION TO EMERGIG NEW INDUSTRIES&
BUSINESS MODELS
FURTHER DECLINE IN HOUSING SECTOR
DEFLATION POSSIBILITIES
ELEVATED LEVERAGE RATIOS&-ve PROFITABILTY
BANKING COS FACING MOUNTING NPAs
STRUCTURAL SHIFT EVISAGED IN THE ECONOMY
STRUCTURAL CHANGES UNFOLDING IN BANKING
&FINANCIAL MARKETS
VERY LOW LEVELS OF DOMESTIC SPENDING
INTRODUCTION OF FREE MARKET REFORMSMOVE TO A MORE STABLE ,LEANER,QUALITATIVE GROWTH
BROAD BASE DRIVERS FOR GROWTH
IMPROVE DOMESTOC DEMAND AND SPENDING
ROLL OUT DE-CAPACITY INITIATIVES.EXPORT P&M FOR ASSISTED OVERSEAS PROJECTS
DE-STOCK BY EXPORT OF EXCESS INVENTORY FOR AIDED PROJECTS
CAP ON INFRASTRUCTURE INVESTMENTS
RAISE RESOURCES FROM CAPITAL MARKETS VIS-À-VIS BORROWINGS
Raise public debt to spur domestic Govt spending
RAISE SKILL SETS& TALENT IN HIGH END INDUSTRIES
INVEST IN HIGH END ENGINEERING AND ELECTRONICS,AERO SPACE
ROBOTICS etc
ALIGN BUSINESSES MODELS TO MARKETS
IMPROVE DOMESTIC SPENDING THROUGH TAX RATIONALISATION
New consumption policy to fuel rapid growth of
New consumption models
Optimize the structure of fiscal expenditure and innovation
with investment and financing mechanisms in key fields
Deepen the fiscal and taxation system reform to
prevent and mitigate public finance risk
Privatise federal companies with active disinvestments
Drive PPP models
Open Bonds markets to FIIs
Target market Cap to Gdp ratio from 40% to75%
Convert Loans to tradeable securities or stocks in the Banks.
Liberalise Interest rate regime on both deposits &loans
Liberalise exchange rates to benefit exports.
Broadbase &deepen Fex markets and derivatives trading
Conclusion
The paradigm shift that is unfolding in the fundementals of the Chinese economy coupled with major reforms in the banking & financial Sector and efforts to align with free market economics & financial order will no doubt be a very tough and challenging and sometimes painful task. The Chinese are fully prepared for it being witness to the decline and reasons for the decline of the US, Japanese and South Korean & European economies in different times in the present & last few decades.
There are very strong institutional mechanisms in china which are bound to play a very pro -active and pivotal role for successful outcomes more than any thing, the huge financial leverages available to the Chinese government to raise far more public debt and increase market cap of state enterprises through dis investment processes will leave trillions of us$ $ in the hands of the government to clean up the whole banking system. Securitization of loans to tradeable securities is expected to cleaning up of NPAS. Macro economic metrics will remain tight. not suffer greatly unless global economy goes in to recession also an extremly pro-active role by both Taiwan & HonKong both largest partners in FDI flows in to china in the decade of Chinese progress cannot be under estimated given the common financial ,cultural and historical interests and values they share. Even Singapore included in this given the very high level of disposable income in the gdp and traditionally high savings rate , the fiscal measures are expected to greatly infuse more confidence among the people of this large republic to move to a far vibrant technology driven manufacturing &consumption economy in the next decade.
Lastly, given their history, culture and eternal civilisational endurance and their national resolve and the nature of political system with beginning command culture, china is expected to achieve what they have planned in a more facile manner than many in the west would tend to believe or not believe
ACKNOWLEDGEMENTS
NATIONAL BUREAU OF STATISTICS OF CHINA
CHINA BANKING REGULATION COMMISSION
PEOPLES BANK OF CHINA (CENTRAL BANK OF CHINA)
BANK OF CHINA RESEARCH
WORLD BANK FULL REPORT ON CHINESE ECONOMY
OECD STATISTICS ON CHINESE ECONOMY
BIS DATA ON CHINA -BANKING
IMF DATA ON CHINA
KPMG REPORT ON CHINA BANKING
GOLDMAN SACHS HONKONG
U S CONGRESSIONAL COMMITTEE REPORT ON CHINESE ECONOMY
DISCLAIMER; THIS REPORT IS MERELY FOR INFORMATION PURPOSES ONLY.THE REPORT IS NOT BE RELIED UPON FOR TRADE OR INVESTMENTS WITH CHINA.THE REPORT IS PREPARED FROM DATA AVAILABLE IN PUBLIC DOMAIN AND CAN NOT VOUCH FOR THE ACCURACY OF DATA.
( T.V. Krishnamurthy is a Management Professional based in Chennai and a C3S Member. He can be reached at tvk2001@gmail.com)


Comments